ACOS and ROAS are the two most commonly confused metrics in Amazon advertising, but they are actually two sides of the same coin—ACOS measures advertising spend as a percentage of sales, while ROAS measures the sales return generated for every $1 spent on ads, and the two are mathematical reciprocals of each other. Understanding their difference isn’t a math exercise; it’s what determines whether your ad budget is making money or burning it.
This article explains in plain language: the definitions and formulas of both metrics, their key differences, how to calculate Break-Even ACOS, and how to use them for budget decisions. Finally, I’ll introduce how AI agents can help you automatically monitor and optimize both metrics.
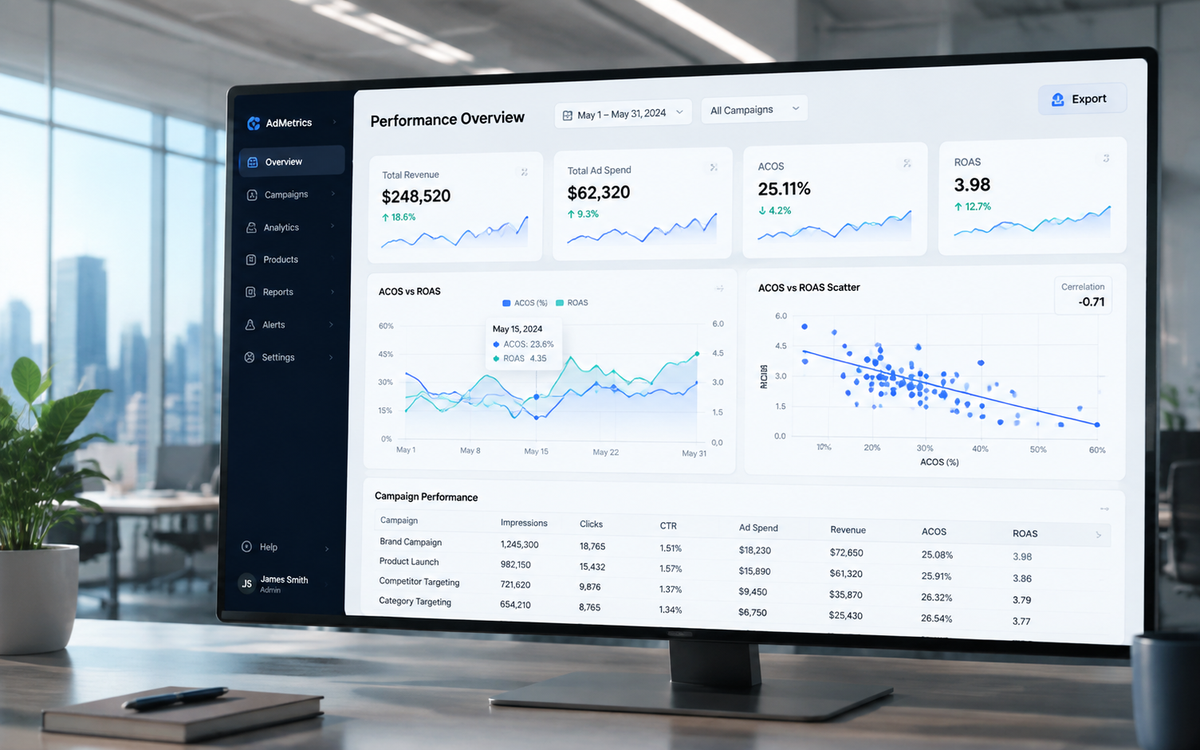
1. Definitions and Formulas of ACOS and ROAS
ACOS (Advertising Cost of Sale)
ACOS is the default metric displayed in Amazon’s Advertising Console. It tells you directly: for every $100 in ad-attributed sales, how much did you spend on advertising?
Formula:
ACOS = Ad Spend ÷ Ad Sales × 100%
Example: Ad spend of $20 generates $100 in ad sales → ACOS = 20%
ROAS (Return on Ad Spend)
ROAS is the industry-standard term (commonly used by third-party tools like Helium 10, Jungle Scout, and Amazon DSP reports). It tells you directly: for every $1 spent on ads, how much sales did you get back?
Formula:
ROAS = Ad Sales ÷ Ad Spend
Example: Ad sales of $100 with $20 ad spend → ROAS = 5 (i.e., $1 spent earns $5 back)
Conversion Relationship
ROAS = 1 ÷ ACOS (with ACOS expressed as a decimal)
| ACOS | ROAS | Meaning |
|---|---|---|
| 10% | 10 | Every $1 spent earns $10 |
| 20% | 5 | Every $1 spent earns $5 |
| 33.3% | 3 | Every $1 spent earns $3 |
| 50% | 2 | Every $1 spent earns $2 |
2. Core Differences Between ACOS and ROAS
| Comparison Dimension | ACOS | ROAS |
|---|---|---|
| Full Name | Advertising Cost of Sale | Return on Ad Spend |
| Perspective | Cost perspective (how much you spend) | Return perspective (how much you earn back) |
| Direction | Lower is better | Higher is better |
| Default Display Location | Amazon Advertising Console | Third-party tools, DSP reports |
| Formula | Ad Spend ÷ Ad Sales × 100% | Ad Sales ÷ Ad Spend |
| Benchmark | Compared against Break-Even ACOS | Compared against Break-Even ROAS |
| Intuitive Meaning | “What percentage of my sales goes to ads?” | “How many dollars do I earn per $1 spent?” |
Why Do Both Metrics Exist?
Because perspectives differ. ACOS is Amazon’s “internal language”—it starts from the seller’s cost structure and tells you what proportion of sales goes to advertising. ROAS is the marketing industry’s “universal language”—it approaches from an investment-return angle, letting you intuitively see the output of every ad dollar.
Practical advice: Use ACOS when working inside Amazon’s backend; use ROAS when reporting to your team or benchmarking against industry standards. The two are instantly convertible—neither is inherently superior.
3. Break-Even ACOS—The Only Number That Matters
Many sellers agonize over “what’s a normal ACOS,” but the question itself is flawed. Whether your ACOS is healthy depends entirely on your Break-Even ACOS.
Break-Even ACOS Formula
Break-Even ACOS = (Price − Product Cost − Amazon Referral Fee − Fulfillment Fee − Other Variable Costs) ÷ Price × 100%
Worked Example (USD)
| Item | Amount |
|---|---|
| Selling Price | $30 |
| Product Cost | $8 |
| Amazon Referral Fee (15%) | $4.50 |
| FBA Fulfillment Fee | $5 |
| Other Costs (storage/creative, etc.) | $2.50 |
| Profit per Unit | $10 |
| Break-Even ACOS | 10 ÷ 30 = 33.3% |
Decision Logic:
| Scenario | Outcome |
|---|---|
| Actual ACOS < 33.3% (ROAS > 3) | ✅ Ads are profitable |
| Actual ACOS = 33.3% (ROAS = 3) | ⚖️ Break-even |
| Actual ACOS > 33.3% (ROAS < 3) | ❌ Ads are losing money |
Industry Reference Ranges (Not Exact Data)
| Scenario | ACOS Reference Range | ROAS Reference Range |
|---|---|---|
| High-price/brand products (mature stage) | 10% – 20% | 5 – 10 |
| Mid-price commodity products (stable stage) | 20% – 35% | 3 – 5 |
| Low-price/new product launch stage | 35% – 60%+ | 1.5 – 3 |
| Inventory clearance/ranking push | Can exceed break-even | Can fall below break-even |
⚠️ Important note: These ranges are experience-based references only; categories vary enormously. The only correct benchmark is your own Break-Even ACOS.
4. How to Use ACOS/ROAS for Budget Decisions
Scenario 1: Mature, Stable Products
Goal: Profit maximization
- Set target ACOS at 70% – 80% of Break-Even ACOS (leaving profit margin)
- Example: Break-Even ACOS of 33.3% → target ACOS of 23% – 27%
- Corresponding ROAS target: 3.7 – 4.3
Scenario 2: New Product Launch
Goal: Data accumulation + ranking push
- Accept ACOS above Break-Even ACOS, even reaching 50% – 100%+
- Core logic: new products lack reviews and ranking; low conversion rates are normal
- Set a time boundary (e.g., 4 – 8 weeks), then evaluate whether to gradually reduce ACOS
Scenario 3: Inventory Clearance / Ranking Push
Goal: Rapid sales velocity
- Accept ACOS significantly above break-even
- This is essentially “buying speed with money”—make clear this is a short-term strategy, not the norm
Scenario 4: Keyword-Level Optimization
| Keyword ACOS Performance | Recommended Action |
|---|---|
| ACOS < 50% of Break-Even ACOS | Increase bid to win more impressions |
| ACOS at 50% – 80% of Break-Even | Maintain current bid; monitor trend |
| ACOS at 80% – 100% of Break-Even | Lower bid, or optimize listing to improve conversion |
| ACOS > Break-Even ACOS | Pause or negate the keyword (unless strategically valuable) |
5. Common Misconceptions
| Misconception | Reality |
|---|---|
| “Lower ACOS is always better” | Excessively low ACOS may mean missed impression opportunities; find the balance between profit and scale |
| “ROAS of 4 means healthy” | ROAS without Break-Even context is meaningless; your product might profit at ROAS 3, or lose money at ROAS 6 |
| “Amazon’s average ACOS is X%” | No official unified data exists; categories vary enormously |
| “High ACOS during launch = bad advertising” | Elevated ACOS during launch is normal; what matters is whether the trend is declining |
| “Just track one of ACOS or ROAS” | They’re reciprocals, but ROAS is more intuitive for team communication, while ACOS is more practical for backend operations |
6. How AI Agents Can Assist ACOS/ROAS Optimization
The core pain point of Amazon ad optimization isn’t “not knowing the formula”—it’s too much data, changing too fast, and not enough human bandwidth to monitor it all. An ad account can have hundreds of keywords, each with ACOS changing in real time. Manually adjusting bids daily is nearly impossible.
What Can AI Agents Do?
| Application Scenario | AI Agent Capability |
|---|---|
| Automated ACOS monitoring | 24/7 account monitoring with real-time alerts on abnormal ACOS fluctuations |
| Break-Even ACOS calculation | Deterministic computation based on product margin and price; auto-updates each product’s break-even line |
| Bid adjustment recommendations | Auto-generates raise/lower/pause suggestions based on deviation between keyword-level ACOS and target ACOS |
| Time-slot/keyword-level optimization | Analyzes ACOS performance across time periods and keywords; outputs optimization priorities |
| Automated weekly/monthly reports | Summarizes ACOS/ROAS trends, spend distribution, and anomalies into readable reports |
From “Manually Watching Data” to “AI-Assisted Decision Making”
The traditional workflow: log into the backend daily → export reports → filter high-ACOS keywords → manually adjust bids → check results the next day. This process is time-consuming and reactive.
The AI agent workflow: automatically pull data → compare against Break-Even ACOS → identify anomalies and opportunities → generate optimization recommendations (or execute directly) → continuously learn and iterate.
Positioning note: If you want to implement AI agents in your Amazon advertising operations, markshuo.com offers AI Agent customization and implementation support services, helping businesses upgrade from “manually watching data” to “AI-assisted decision-making” in ad operations.
7. FAQ
Which is more important: ACOS or ROAS?
Neither is more important—they are two expressions of the same relationship. ACOS is the cost perspective (lower is better); ROAS is the return perspective (higher is better). The key isn’t choosing one, but knowing your Break-Even ACOS and using it to judge whether your ads are profitable.
What is a “normal” ACOS?
There is no universal “normal” value. Whether your ACOS is healthy depends on your product margin. A product with a 50% Break-Even ACOS is profitable at 40% ACOS; a product with a 15% Break-Even ACOS is losing money at 20% ACOS. The only correct benchmark is your own Break-Even ACOS.
How do you convert between ACOS and ROAS?
ROAS = 1 ÷ ACOS (with ACOS as a decimal). Example: ACOS of 20% (0.2) → ROAS = 1 ÷ 0.2 = 5. Conversely: ROAS of 5 → ACOS = 1 ÷ 5 = 20%.
Does Amazon’s advertising console show ACOS or ROAS?
Amazon’s Advertising Console displays ACOS by default. ROAS appears more in third-party tools (like Helium 10, Jungle Scout) and Amazon DSP reports.
How do you calculate Break-Even ACOS?
Break-Even ACOS = (Price − Product Cost − Amazon Referral Fee − Fulfillment Fee − Other Variable Costs) ÷ Price × 100%. Example: Price of $30 with $10 profit after all costs → Break-Even ACOS = 10 ÷ 30 = 33.3%.
What should I do about high ACOS during a new product launch?
Don’t rush to cut the budget. New products lack reviews and ranking; high ACOS from low conversion is normal. Recommendation: set a time boundary (e.g., 4 – 8 weeks) to focus on data accumulation and ranking, then evaluate the trend to decide whether to continue investing or adjust strategy.
Conclusion
ACOS and ROAS are not two metrics requiring an “either/or” choice—they are two perspectives on the same advertising performance. What truly matters is: calculate your Break-Even ACOS and use it as the baseline for all advertising decisions. When you can clearly answer “are my ads making money or burning it,” you’ve already surpassed most sellers who optimize by gut feeling.
If your ad account has too many keywords, too much data, and manual optimization can no longer keep pace, consider using AI agents to assist with monitoring and decision-making—this could be the breakthrough for your next phase of advertising profit growth.